

Are We Too Obsessed with Our Weight and Waistlines?
All too often the media and even medical professionals tell us that thinner and lighter is better. As can be seen from the pictures above, most would agree this is not always the case. Many world class athletes regularly weigh in at levels considered moderately overweight by height weight charts with greater amounts of skeletal muscle packed onto their frames. Even though they may not be as thin, they may be stronger, more flexible, have more endurance and display more cardio-respiratory fitness. Many actors who have assumed excessive diets to lose weight for a role have complained about the lasting detrimental effects on their health. I think we all can agree Christian Bale looks much better as Bruce Wayne than he does as the Machinist.
Likewise, we want to make sure our clients consider all levels of their financial fitness. We want to make sure that they do not overly focus on one area to the detriment of others. All too often we find that some clients may completely overlook tax planning, protection planning, intergenerational estate planning, business succession, charitable planning and other areas. Some can be overly focused on maximizing retirement cash-flow without considering how this impacts the long-term plan. Others can be too fixated on returns and expenses without considering the other areas of financial fitness.
For this reason, we developed our WealthFit™ process and the financial fitness charts a few years back to help clients stay focused on the big picture. We most recently developed our WealthFit™ quiz to help clients and their loved ones assess where they are in between our regular checkups and progress reviews.
Click here to take the WealthFit™ quiz.

What does your financial diet look like?
In our household, my wife and I have differing opinions as to which type of diet is best for our health. Jennifer rarely eats meat and almost never touches fish. Sydney, our twelve-year old daughter tends to avoid meat altogether. Our two boys and I cannot seem to keep enough meat in the refrigerator and frustrate Jennifer whenever we note the lack of enough protein in our meals or general availability around the house. She says there is enough protein in the beans and other green things, but we keep asking “where’s the beef?” It seems red blooded American men in general like to make sure we get our steak.
Likewise, some Americans prefer to get all their equity exposure at home. With the media overly focused on calling the U.S. based S&P 500 “the market”, they are perpetuating the notion that we should not venture outside of the “red meat” of the market or large company U.S. stocks.
Along the same vein, investors sometimes do not consider how to develop a balanced portfolio with enough smaller companies, non-U.S. companies and emerging markets exposure. They feel the equity market is solely comprised of the S&P 500 and are placing themselves at risk to suffer the same or similar fate of many at the end of the 1990s. Things did not end well for those who were overly focused on the most-trendy areas. S&P Indexing is not quite as popular as it was then and the dot.com bubble has been replaced with Krypto-F.A.N.G. mania but the risk of a 1990s type bubble continues to increase.
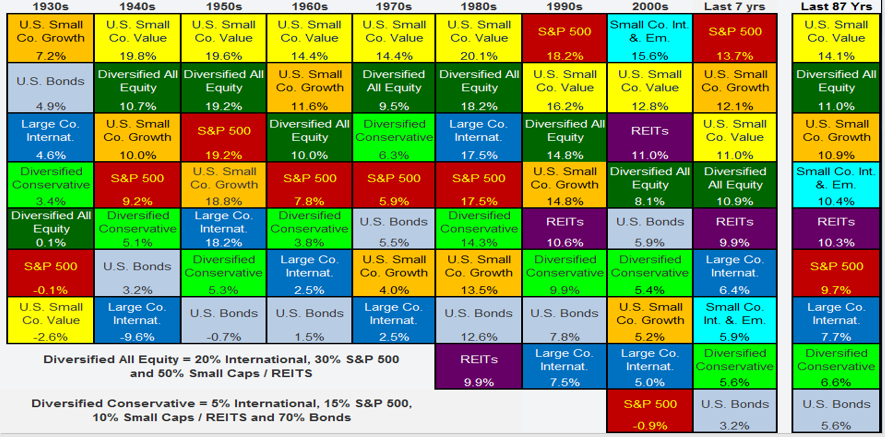
As can be seen from the chart below, the 1990s showed us what happens when the S&P 500 becomes too popular. The 1990s was followed by the 2000s, otherwise known as the “lost decade” for those solely invested in U.S. large companies. Emerging markets were the best performers of the 2000s, followed by smaller companies. What the media and others failed to see then and still fail to today is that those who were well diversified managed to navigate these troubled waters relatively well during the 2000s.
The Current Conservative Investor Dilemma
During most of the 2000s, conservative investors, owning primarily bonds did not suffer like those invested solely in large U.S. companies. Unfortunately, it is much harder today for these conservative investors to maintain their income requirements primarily in bonds with yields close to all time lows. The chart above shows a diversified conservative portfolio with a 70% bond allocation provided these investors with a 5.5% return over the past 17 years (down from 12.1% in the 1980s and 1990s). To keep portfolios more stable, more diversification is required. The most stable portfolios tend to have the most types of investment options although bonds typically provide the most certainty. Unfortunately, those who want the most stability will need to revise their expectations toward the 4% to 5% range going forward.
For Those Trying to Predict the Future
Those wishing to optimize portfolios for best performance without considering the downside may want to look at what has worked best over time. If we were to set our investment strategy in a way we could potentially take an extended 15+ year trip and not touch our holdings during that time, how would we want to structure our portfolio? What would be the optimum diet?
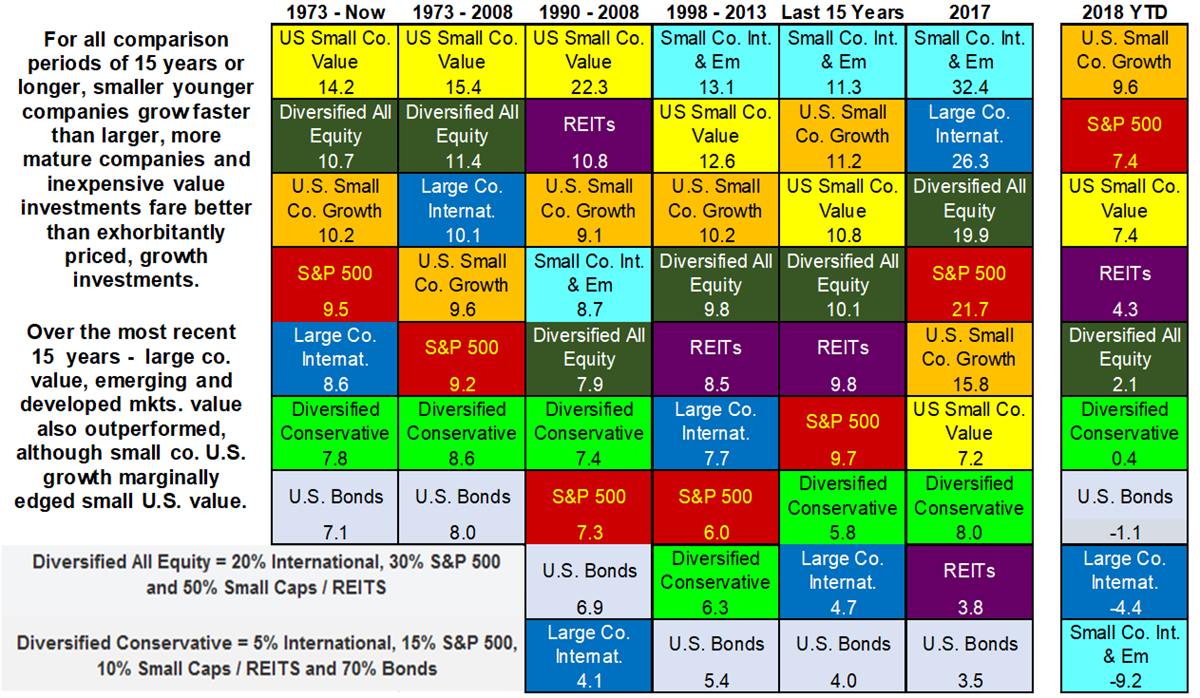
The chart below shows multiple time periods of 15 years or longer and two short time periods. If we were to look at all these 15+ year periods we should be able to note that smaller, younger companies tend to grow faster than larger mature companies, value investments bought at inexpensive prices tend to hold up better than growth investments bought at exorbitant prices and emerging economies tend to grow faster than developed economies. This is the case over almost every 15-year period we can study over the last 90+ years with value beating growth by 2.3% and smaller, younger companies growing faster than larger mature companies by 2.2% on average since 1929. Emerging economies and their companies have also outperformed developed economies and their companies in general since the emerging markets index first started tracking these in the late 1980s. We should take a closer look at U.S. equity investments versus non-U.S. developed markets and emerging economy companies for further edification.
Why Try Something Other than Red Meat?
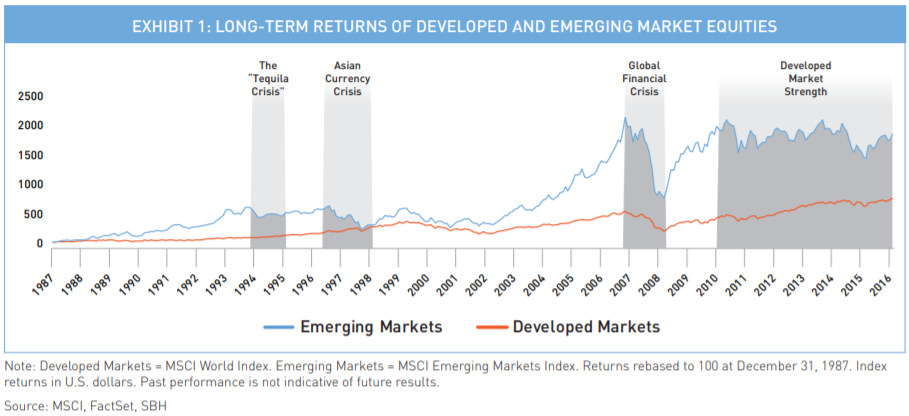
The chart below graphically shows how emerging markets have fared versus developed markets with periods of extreme out-performance and periods of moderate under-performance in the late 1990s and recently. It’s hard to ignore that the United States has been arguably the best country to live and invest in over the past century. U.S. companies fared exceedingly well against those of other countries during both World Wars and immediately afterward by supplying the rest of the world with goods and services while they fought on foreign shores, recovered and rebuilt.
However, there have been periods when overseas markets have fared better and we have seen several economies which have grown faster than ours during the last couple of decades. U.S. companies no longer comprise the majority of publicly traded companies throughout the world as other economies emerge, grow and mature. Since the height of the 1973 market, U.S. investments have outperformed those overseas although non-U.S. developed markets held up better through the end of the financial crisis in 2008.
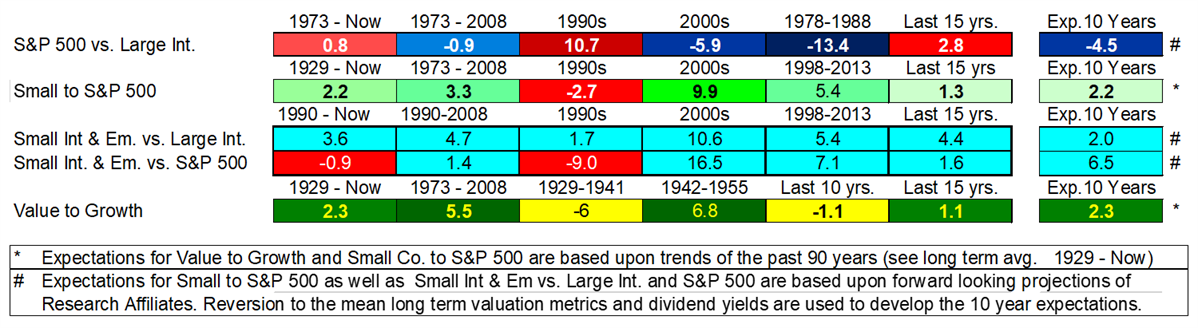
Knowing whether emerging markets, developed Non-U.S. markets or U.S. markets will grow fastest or be the best performer over the next year, ten years or even the next 25 years is much harder to determine. Smaller, younger companies and attractively valued companies tend perform more consistently over time and we can reasonably expect that this will continue, but what should we expect from companies of emerging and developed economies outside of the U.S. The 1990s and the last ten years show many similarities. The largest degree of outperformance for the S&P 500 over that of developed non-U.S. markets and emerging markets was seen in the 1990s with returns in excess of 9% over these markets on average. As can be seen from the first decades of returns chart above the current decade is the only other decade where the S&P 500 has outperformed all other asset classes on the chart.
If we were to assume the next decade will be most similar to the 2000s based upon the last seven to eight years being extremely similar to the 1990s, we would come to the conclusion that developed non-U.S. markets will outperform the S&P 500 by several percentage points and emerging markets will outperform by an even larger degree. Research Affiliates’ publishes ten-year forecasts for these indices based primarily upon ten-year average price to earnings valuation metrics and dividend yields. Their research assumes developed non-US markets and emerging markets will exceed those of the S&P 500 by 4.5% and 6.5% respectively over the next ten years. An analysis of their criteria for these forecasts can be studied by following this link.
We are primarily concerned the S&P 500 will continue to gain more attention from the media and the Krypto-F.A.N.G. mania will seduce more investors to buy in-spite of increasingly exorbitant prices. We encourage investors to maintain a balanced and diversified diet of investment options based upon what has proven to work over time, not what has done best recently. More importantly, we encourage everyone to pay more attention to all aspects of financial fitness rather than overly-focusing on their financial weight and waistlines.
To take a self-assessment of your financial fitness, feel free to follow this link.

Joe D. Franklin, CFP is Founder and President of Franklin Wealth Management, and CEO of Innovative Advisory Partners, a registered investment advisory firm in Hixson, Tennessee. A 20+year industry veteran, he contributes guest articles for Money Magazine and authors the Franklin Backstage Pass blog. Joe has also been featured in the Wall Street Journal, Kiplinger’s Magazine, USA Today and other publications.
Important Disclosure Information for the “Backstage Pass” Blog
Please remember that past performance may not be indicative of future results. Indexes are unmanaged and cannot be invested into directly. Index returns do not reflect fees, expenses, or sales charges. Index performance is not indicative of the performance of any investments. Different types of investments involve varying degrees of risk, and there can be no assurance that the future performance of any specific investment, investment strategy, or product (including the investments and/or investment strategies recommended or undertaken by Franklin Wealth Management), or any non-investment related content, made reference to directly or indirectly in this blog will be profitable, equal any corresponding indicated historical performance level(s), be suitable for your portfolio or individual situation, or prove successful. Due to various factors, including changing market conditions and/or applicable laws, the content may no longer be reflective of current opinions or positions. Moreover, you should not assume that any discussion or information contained in this blog serves as the receipt of, or as a substitute for, personalized investment advice from Franklin Wealth Management. To the extent that a reader has any questions regarding the applicability of any specific issue discussed above to his/her individual situation, he/she is encouraged to consult with the professional advisor of his/her choosing. Franklin Wealth Management is neither a law firm nor a certified public accounting firm and no portion of the blog content should be construed as legal or accounting advice. A copy of Franklin Wealth Management’s current written disclosure statement discussing our advisory services and fees is available for review upon request.