
Trick or Treat – These Returns Can’t Be Beat?
Watch the included video to see Elwood Blues explain “Halloween Indicator”.
Halloween can be a scary time for many, including those investing in the markets. August and September have been the worst performing months for the markets during my entire lifetime and many times we see the market hit bottom in October. This year, October 27th may prove to be the low for the remainder of the year as borne out by the “Halloween Indicator”. Many have heard the term, “Sell in May and Go Away” but when thinking about when to buy many may want to remember, “Buy in October and Get Yourself Sober”. Historically the best five months of the year to own stocks are found in the months from November to the end of April. Those who own stocks during the “strong months” have done almost as well during these months as they have owning the entire year when looking back to the mid-1950s. Yale Hirsh first wrote on this strategy back in 1986 and through 2022 these six strong months combined have produced an average DJIA gain of 7.3% since 1950, compared to an average gain of just 0.8% during the months May to October.
Sy Harding wrote “the book” on seasonality in the late 1990s. He improved upon a sell on May 1st and buy on November 1st system by using a simple Moving Average indicator which waits to buy in October or November when the 50-day moving average crosses above the 200-day average. This change in trend is also known as the “Golden Cross”. Harding wrote that using the “Golden Cross” to buy and the “Death Cross” to sell along with seasonality was the “most powerful mechanical system ever”. I first read his book on my honeymoon in January 2003 and have noted when it works best and falls short.
This system worked in 58% of 1-year periods, 79% of 5-year periods and 82% of 10-year periods since 1950. The system works better when bonds and CDs are paying rates over 3.5%. When this is the case, fixed assets outperform the market during the weak months in 63% of all years, 95% of 5-year periods and 96% of 10-year periods. Seasonality did not work quite as well prior to the mid-50s and since 2012 but started working again in 2022.
“Selling in May” has worked best when the markets have underperformed during the preceding “strong months”. The market continued to underperform during the following “weak period” 79% of the time, after an underperforming “strong period”. The years when the market has done well after a negative good period include 2003, 2009 and 2020: all periods when the Federal Reserve started to stimulate and lower interest rates aggressively.
Seasonality tends to work well with most markets. Professor Ben Jacobsen from the New Zealand Institute of Advanced Study found that the “Halloween Indicator” works well in 36 of 37 developed markets. The strategy works even better for Nasdaq stocks and smaller companies although most studies show the impact of this strategy with the Dow Jones Industrial Average.
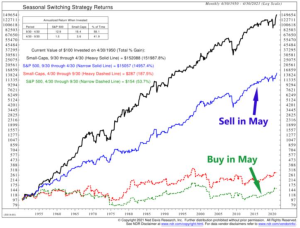
This seasonal strategy has been a bonanza for investors, capturing the bulk of the market’s gains that occur from November to April, while avoiding the volatility, penchant for downdrafts and sideways action that tends to materialize in the Worst Six Months May-October.
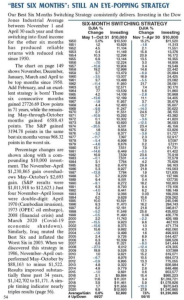
Below is an excerpt from the almanac started by Yale Hirsh many years ago which first published this strategy. The figures show historical results through 2020 and looks even better when considering how it would have protected investors in early 2022.
Joe Franklin has been recognized as one of the TOP ADVISORS in Tennessee

Franklin Wealth Management
4700 Hixson Pike
Hixson, Tn 37343
423-870-2140