


THE MARKET HATES UNCERTAINTY
There are plenty of Sellers out there who are concerned about the upcoming election, trade wars, rising interest rates and the like. As one market commentator put it last week,
“The perfect storm was caused by a trifecta of news. First, China wanted to hurt the U.S., defend its currency (the renminbi), and boost its economy. As previously stated, China can do this with one maneuver. Sell Treasuries, which raises interest rates in the U.S., hurting the consumer and potentially hurting President Trump right in front of the mid-term elections. When they sell Treasuries, they receive U.S. dollars that can be used to buy renminbi and support their currency. They flush the purchased renminbi into their economy and presto, it hopefully juices it up. Second, the Fed is raising interest rates for multiple reasons. The economy is strong and the Fed is attempting to get to a “neutral rate” in case the economy softens, so they will have some room to lower rates to stave off a recession. And three, did you notice how the equity markets turned sloppy when the “nose counters” said there is near a 100% probability the Democrats will take the House of Representatives?”
Here are some cold hard facts:
1. During the month of October, the S&P 500 was down 11.3% from peak to trough (If Monday, October 29 was indeed the bottom). Smaller companies started selling off sooner and the Russell 2000 (made up of these smaller U.S. companies) was down 14.2% over this same period. Last month is officially the worst month since February of 2009 and the worst October since 2008. Remember those months?
2. Did you know that during the third quarter (the one that just ended), there was no daily move in the S&P 500 of more than 1%? The last time that happened was 1963. I was not even born yet. However, this month we have seen six days of +/-1%…that’s about 33% of the trading days this month.
3. The S&P 500 has lost ground on 15 days out of the 21 trading days this month. That’s more than any month since May 2012.
We have been here before…remember 2016? No? Well thankfully I wrote a blog called “Did You Lose Your Head This January?”.
The S&P 500 sold off 10% through February 11th, 2016. It was at 1,829 and then Rallied through the end of the year.
Today it’s at 2,719…after this horrible October.
WHEN WILL WE GAIN MORE CERTAINTY?
After the Election on Tuesday we will know which party will hold the majority of the House and the Senate. The buyers who have been noticeably absent will be able to take positions accordingly to benefit from any potential changing of the guard. China also has less reason to sell Treasuries and cause a spike in interest rates. The Federal Reserve is also less likely to raise rates in the midst of market weakness, although it seems the current Fed. Chair may not be as concerned about these factors.
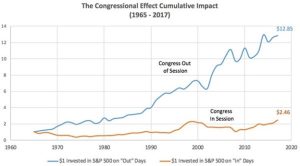
It is likely a scenario will unfold similar to what we saw during the 2016 Presidential Election where the markets sold off prior to the election and rallied sharply thereafter. Our thinking would lead us to believe that the market will rally regardless of the party in control of Congress. In fact, studies have shown that markets tend to prefer gridlock and bi-partisan legislation. The chart below shows that the markets prefer a Congress that does nothing, especially when it is out of session.
HISTORICAL DECLINES
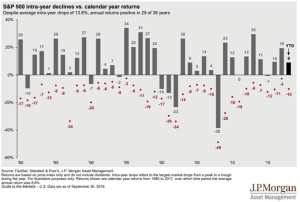
The chart below from J.P. Morgan shows you that the market reminds us that selloffs happen…twice a year. Going back to 1980, the average drop during a calendar year is 13.8%. Each red dot shows you the maximum loss from the peak of that calendar year. The dark bars show the actual return for that year…see how 29 of the 38 years ended positive? (The data is as of the end of the 3rd quarter.)
I’m not saying readers and clients don’t have a reason to be upset. No one likes losing money. I’m just saying there is no good reason to panic about this. The statistics show the smart thing to do is leave your portfolio alone.
Take stock of how you feel right now. When the market recovers, because it will, please remember how you felt right this second. That’s the time to think about action. At that time, figure out if you need cash over the next 12-18 months or want to be more conservative. After the recovery, consider reducing risk or raising cash.
Financial plans use statistics and averages. Of course, they are not perfect, but they are useful for creating a base case and adjusting as things change. The problem is that averages are made up of a distribution of individual calendar year returns over time. It’s living through the severe individual calendar years of returns that cause investors so much pain.
The key is to let the individual calendar years, whatever they may be, collect up into the average. That takes patience and discipline.
There is no return without risk.
Over 2008-2009, the worst financial time to hit an investor since the Great Depression, the Dow fell over 50%. It recovered by April of 2011…total time to recover was two years. Those who had a plan and forecasted their cash needs for 18 months probably did okay.
We ask you to focus on the long-term, while we all wake up every day living the short-term. Please call us if you have any immediate concerns about your individual situation – we are here to listen, and if necessary we will adjust anyone’s investment strategy if his or her individual situation has changed over the last month

Joe D. Franklin, CFP is Founder and President of Franklin Wealth Management, and CEO of Innovative Advisory Partners, a registered investment advisory firm in Hixson, Tennessee. A 20+year industry veteran, he contributes guest articles for Money Magazine and authors the Franklin Backstage Pass blog. Joe has also been featured in the Wall Street Journal, Kiplinger’s Magazine, USA Today and other publications.
Important Disclosure Information for the “Backstage Pass” Blog
Please remember that past performance may not be indicative of future results. Indexes are unmanaged and cannot be invested into directly. Index returns do not reflect fees, expenses, or sales charges. Index performance is not indicative of the performance of any investments. Different types of investments involve varying degrees of risk, and there can be no assurance that the future performance of any specific investment, investment strategy, or product (including the investments and/or investment strategies recommended or undertaken by Franklin Wealth Management), or any non-investment related content, made reference to directly or indirectly in this blog will be profitable, equal any corresponding indicated historical performance level(s), be suitable for your portfolio or individual situation, or prove successful. Due to various factors, including changing market conditions and/or applicable laws, the content may no longer be reflective of current opinions or positions. Moreover, you should not assume that any discussion or information contained in this blog serves as the receipt of, or as a substitute for, personalized investment advice from Franklin Wealth Management. To the extent that a reader has any questions regarding the applicability of any specific issue discussed above to his/her individual situation, he/she is encouraged to consult with the professional advisor of his/her choosing. Franklin Wealth Management is neither a law firm nor a certified public accounting firm and no portion of the blog content should be construed as legal or accounting advice. A copy of Franklin Wealth Management’s current written disclosure statement discussing our advisory services and fees is available for review upon request.