
Unemployment Rates Hit New Yearly High
Does this mean Interest Rates Have Peaked?
It seems that a lot of people had a blast at our Hurricane Survival Halftime Event in July. Lots of beads were passed out and lots of stories and pictures were shared. As always, we stressed that we did not know exactly what was going to happen in the future. We like to develop a range of likely outcomes based upon current data, trends, and how this data led to other events in the past. We have just released our 2023 Halftime Report on YouTube. You can access this by clicking the link above.
The Federal Reserve raised rates in 2022 at the fastest pace since the early eighties in its battle to stop inflation. They have continued to raise rates in 2023 as well, although the pace has slowed recently. It is likely short-term rates peaked in May with the one-month yield hitting 6.02% during the last week of the month. Until recently some thought the longer-term rates had reached their peak at 4.59% in October of 2022. Last month, the 20-year yield rose to 4.64% and may continue to rise as the Treasury continues to re-issue maturing long-term bonds with few buyers on the horizon. Fitch cut the ratings on our government debt last month and with many expecting the advent of a new BRICS currency, the dollar could lose some of its appeal. If this trend continues, buyers of U.S. treasury bonds may be more reluctant to fund our nation’s rising debt load unless they are able to secure higher rates.
Higher Unemployment Preceding Recessions
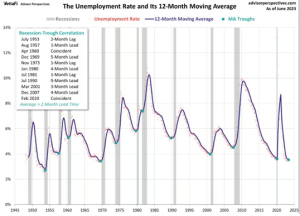
Recessions have been previously defined as two consecutive quarters of negative real Gross Domestic Product growth (after inflation). In 2022 because the job market was still so strong, many were reticent to call the inflationary slowdown a recession. Things have changed recently.
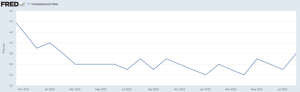
The St. Lois Federal Reserve Unemployment Rate data was released on Friday, September 1st. As can be seen from the chart above, unemployment currently sits at the highest level we have seen since February 2022. But let’s look at what has historically happened after unemployment bottoms and starts to trend upwards again. In January and April, Unemployment hit 3.4%. May and June provided two consecutive months above the 12-month moving average. This two-month period above the 12-month moving average is the first sign we see that unemployment is rising. The second sign we look for is a break above the previous 12-month high for unemployment. Many times, a new 12-month high in unemployment is attained at the same time we see two consecutive months above the 12-month average. This time the second signal didn’t come until this past month of August.
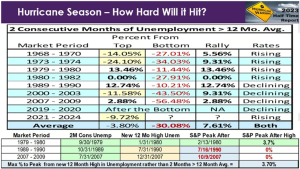
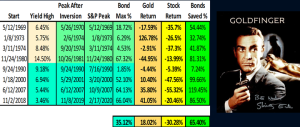
When this happened in the past, it was typically not long before unemployment spiked, and we were in the middle of a recession. In the past, the markets on average have rallied close to 8% from the time the data comes out only to fall significantly afterward. From the data below, you can see how the markets have fared after unemployment begins its upward trajectory. Keep in mind that the 2 months above the moving average was attained at the end of June 2023.
We have now gotten further confirmation of higher unemployment. When this confirmation has been provided in the past, many times the equity markets have already hit their highs and we see markets starting to crack. In roughly half of the recessionary periods of the last fifty plus years, the markets topped long before employment started showing signs of slowing. In half of these instances, we were able to get advance warning by looking at unemployment data to see when the last two consecutive months crept above the 12-month average unemployment rate. When we have seen 12-month unemployment highs in the past, there has only been one instance in the past fifty plus years where the markets continued to rally past this point before the sell-off commenced.
What Are the Federal Reserve Expectations?
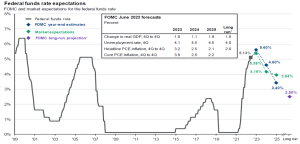
In June, the Federal Reserve was expecting the Fed Funds Rate to be at 5.6% by the end of the year. With the rate currently at 5.5%, this would give about a 40% chance of another rate hike. The markets had been expecting the Federal Reserve to stop raising rates a few months ago. We would anticipate that if the markets continue to perform relatively well when they meet again on September 19-20, we will see another hike. They likely want to get as much runway in front of them to fight inflation before shifting gears to save the economy from more recessionary pressures.
The Federal Reserve has been expecting higher unemployment to also kick in. The chart below shows they currently expect unemployment to rise further to 4.1% by the end of the year and 4.5% in 2024.
How Do We Want to Position Ourselves Now?
Good Positioning:
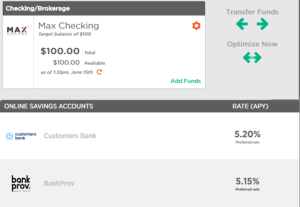
In times like these, we want to protect ourselves from the drawdowns in equities and reduce exposure. Conversely, we know other asset classes tend to do well. Bonds, gold, and other precious metals tend to outperform in recessions, and we want to take advantage of this. Short-term bonds and CDs are already paying better than 5.5% currently. Shifting more to high-interest savings accounts, CDs and short-term treasury bonds may be a good solution. Many have enjoyed utilizing our CashMax solution to maximize short-term savings rates over the past few months.
Better Positioning:
If we consider that rates have come down during all previous recessions of the past fifty-plus years, we may want to look at locking in for a longer period. This can be done by utilizing fixed- annuities. We have recently seen rates as high as 5.65% for as long as seven years over the past few weeks.
Best Positioning:
For those who wish to potentially do better than the norm, we would propose you consider intermediate to long-term treasury bonds and precious metals. The chart above shows how owning longer-dated treasuries fared in the last four recessions, and how those who started in short-term treasuries and shifted to longer-dated treasuries after these started paying higher yields fared during the seventies and early eighties. These recessionary periods consistently saw lower yields over time as the Federal Reserve dropped rates to fight economic malaise. When rates drop, bond prices rise and during tough recessions, rates can drop dramatically. This has historically provided outsized returns in longer-dated treasury bonds. Gold and other precious metals also tend to do well, but not quite as well as the long-dated treasury bonds.
At the beginning of the year, our Forecast Event was entitled “Bringing Bonds Back in Style.” We have written several articles on how bonds help reduce risk exposure especially when stocks start to get expensive and how bonds may fare best during recessionary periods. You can access some of these articles and videos by following the links below.
What to do in an Inflationary Recession? – Franklin Wealth Management (franklin-wealth.com)
Perils of Reverse Dollar Cost Averaging in a Volatile Market
Joe Franklin has been recognized as one of the Top Financial Advisors in Tennessee

Franklin Wealth Management4700 Hixson PikeHixson, Tn 37343423-870-2140www.franklinwealth.com